
High Level Incident Overviews and Strategies
It is an unfortunate reality that no system which delivers complex health care is free from risk or error. It is globally recognised (World Health Organisation, 2017) that errors in healthcare delivery are the cause of unintended harm and at times, associated with poor outcomes for patients.
Ensuring patient safety and the delivery of high quality care at all times is the number one priority for EMHS. To support this, EMHS has a proactive and transparent patient safety culture that uses a non-punitive approach to the reporting of and learning from, clinical incidents or errors.
So that the health service can adequately investigate the causes of clinical incidents, each incident is assigned a rating known as a Severity Assessment Code (SAC) score that guides staff in the type of investigation method to be applied to each event. Clinical incidents that result in serious harm or death (SAC 1) require a very detailed, rigorous investigation facilitated by an expert panel, members of which may at times be completely independent to the health service.
Measuring high level incident overviews and strategies
Clinical incidents can be represented as a rate per 1,000 occupied bed days. This can give an idea of how busy a hospital is at the time that incidents are reported, and can help inform us about how successful the culture of open and transparent reporting is.
When an incident is reported and investigated, one of the things reported is whether a patient is injured and how severe the injury is. We try to learn from every incident, whether or not the incident causes harm, and make changes to systems, processes and procedures to reduce the risk of future incidents happening, and to prevent harm from similar incidents if they do happen. This is the reason that we promote a culture of openness and transparency we prevent future harm If an incident is reported as a near-miss, or causing no harm.
How do we measure up
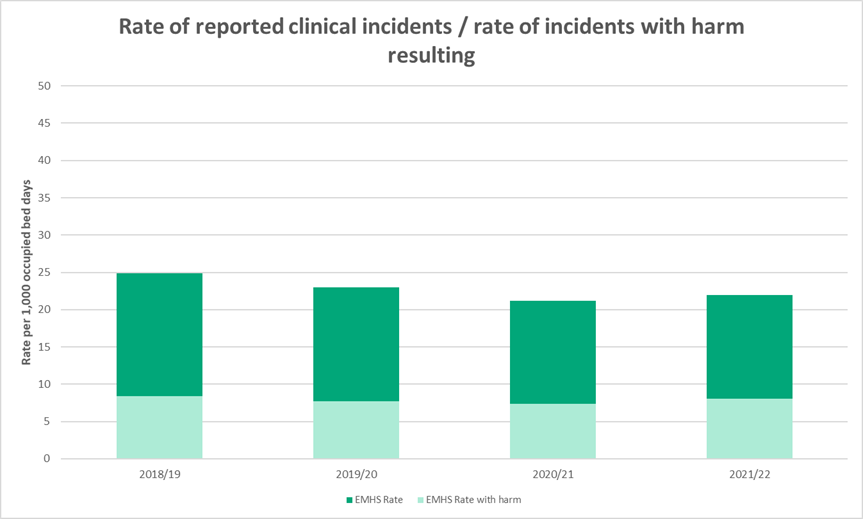
The graph below shows the combined incident rate for the EMHS hospitals:
- Armadale Health Service
- Kalamunda Hospital
- Bentley Hospital
- Royal Perth Hospital
Chart: Rate of reporting of clinical incidents per 1,000 occupied bed days: All reported inpatient clinical incidents and inpatient clinical incidents resulting in harm.
What the figures mean
The graph shows the rate of reported inpatient clinical incidents per 1,000 bed days. The darker coloured bar shows the total rate of all inpatient clinical incidents, and the lighter coloured bar shows the rate and fraction of incidents that resulted in harm of any kind.
The higher total rate of reported incidents and the consistently high rate of reporting show that the culture of reporting incidents is healthy and effective. Note that the rate of incidents resulting in harm has remained low – this shows that the health system learns from events and introduces effective programs to prevent and minimise harm resulting from incidents.
Learning from Clinical Incidents
Situation
Following a same-day procedure, a patient was not provided with an important appointment for follow-up which resulted in the delayed diagnosis of a serious disease. Through clinical incident investigation it was identified that there was a lack of a standardised process with an allocated responsibility for booking surgical outpatient appointments.
Recommendation
To develop and publish a booking process for surgical outpatient appointments that identifies the person responsible, with an approach for communicating this to all surgical outpatients.
Result
The recommendation prompted an outpatient reform process resulting in an electronic dashboard implemented for Outpatient Clerks to follow-up appointment requests by clinicians and identify patients who have received no follow-up from their appointment.